Transit Planning, Policy and Performance
Because IndyGo is a recipient of federal, state, and local tax dollars, we are required to follow various federal, state and local statutes, which further require us to solicit and review public input on a regular basis. IndyGo uses a variety of planning tools, policies, performance-monitoring methods and decision-making procedures to ensure our transit system is running safely, efficiently and effectively.
Public Open Houses
IndyGo hosts open houses at the Julia M. Carson Transit Center for riders and non-riders to understand how service standard changes are made and learn about public involvement plan updates. Stay tuned to this page to learn about upcoming dates.
Service Standards
Last amended by the IPTC Board of Directors in April 2026, IndyGo’s service standards are the foundation for all service planning policy and decision-making. They inform our efforts to improve route structure, span of service, service frequency, on-time performance, and more.
To learn more about IndyGo’s Service Standards, click here.
Determining Demand
Tracking and reporting on ridership is just one of the metrics IndyGo uses to determine how many service hours to put on the street. IndyGo uses both electronic fareboxes and automated passenger counters (APCs) to count passenger trips. Unlike electronic fareboxes, APCs provide valuable data on a stop-by-stop basis, giving us insight into rider volume, patterns, and predictability.
Ridership tends to vary throughout a given route’s hours of operation, peaking at certain times during the weekday and at different times on the weekend. When we can, we ramp up our services to meet this demand and then scale them back down. But not all routes are the same. Some routes require consistent service levels throughout the entire day.
Route Performance
We use two productivity measures to formulate an overall productivity rating by route: ridership productivity and economic productivity. Ridership productivity is measured in riders per revenue hour of service. Economic productivity is measured in operating subsidies per passenger.
Bus Stops & other Passenger Amenities
IndyGo’s system includes more than 2,400 bus stop locations.
Our service standards here call for bus stop spacing of 1/4 mile where frequency and pedestrian infrastructure allow, providing access for riders while minimizing delays in the service itself.
We rely on established stop guidelines to help us determine what investments will be made at each location for amenities such as shelters, benches, bike racks, and solar lights. To learn more about our methodology and amenity options, click here.
To maintain its future service plan, IndyGo conducts a Comprehensive Operational Analysis (COA) of our transit system every five years. These in-depth studies help identify service strengths and opportunities for improvement, even when there are local route improvements that haven’t been made yet. Below are summaries of the past several COAs that IndyGo has performed.
2022
We’re Getting Indy Moving Again!
During the pandemic, IndyGo pressed pause on the remainder of its network redesign. Beginning in 2021 and throughout 2022, IndyGo performed another COA aimed at reviewing the remaining service modifications. After several months of community and stakeholder outreach that was followed by an intensive public engagement period during the month of October 2022, IndyGo staff put forward some strategic changes to the remainder of the network redesign. The result is a new future service plan that will be phased in over the next several years. This updated plan reinforces the vision developed in the 2016 MCTP and reflects the changes in how people travel as well as our future revenue projections.
This research and these findings informed the Indianapolis Metropolitan Development Organization’s update to the larger Central Indiana Transit Plan. For more information about this plan, click HERE.
2015
Putting a Plan in Motion!
The desire to redesign IndyGo’s entire bus network was established in the 2016 Marion County Transit Plan (MCTP). It was this plan that created the steadfast vision to shift IndyGo from a largely coverage-designed system to a system that focused on generating more ridership. This version of the MCTP has been updated several times since its adoption, and significant progress has been made toward completing IndyGo’s network redesign. Most notable are the launch of the Red Line bus rapid transit route, the deployment of service seven days a week, an increase in service frequency for some routes, and new buses.
IndyGo Forward Volume II Final Report
2010
Laying the Groundwork!
In December 2009, the Indianapolis Metropolitan Planning Organization (IMPO) and IndyGo commissioned the completion of a Comprehensive Operational Analysis (COA) aimed at providing a comprehensive understanding of the existing IndyGo transit system and the travel market it operates within, providing the basis for designing a new network plan. The need for the plan stemmed from the desire to improve the efficiency, effectiveness, and performance of the current IndyGo system while responding to a decrease in funding levels following the economic recession that occurred between 2007 and 2009. Key to the study was the need to find strategies to better use existing resources to grow system ridership pending more significant financial resources becoming available as part of the development of a Central Indiana Regional Transportation System.
2005
An Idea Takes Hold!
Completed in March 2005, this analysis examined current and future needs that, at that time, centered around optimizing the existing system, improving, and expanding the system, and supporting a region-wide rapid transit system.
Here is a month-to-month breakdown of the number of passenger trips on IndyGo’s local routes. (Please note that IndyGo Access ridership is not reflected in this data.)
(YTD ridership numbers may be updated from prior periods occasionally due to buses being probed after the 10th of the month.)
2026 Ridership
| January | 505,047 |
| February | 520,254 |
| March | 573,029 |
| April | 593,686 |
| May | |
| June | |
| July | |
| August | |
| September | |
| October | |
| November | |
| December | |
| Total | 2,192,016 |
2025 Ridership
| January | 503,182 |
| February | 508,304 |
| March | 565,249 |
| April | 582,502 |
| May | 590,617 |
| June | 548,222 |
| July | 519,590 |
| August | 595,760 |
| September | 593,848 |
| October | 632,827 |
| November | 515,008 |
| December | 502,781 |
| Total | 6,657,890 |
2024 Ridership
| January | 506,512 |
| February | 550,034 |
| March | 577,556 |
| April | 576,396 |
| May | 616,391 |
| June | 566,790 |
| July | 589,866 |
| August | 641,964 |
| September | 603,300 |
| October | 640,210 |
| November | 557,329 |
| December | 537,900 |
| Total | 6,964,248 |
2023 Ridership
| January | 531,815 |
| February | 499,974 |
| March | 555,965 |
| April | 550,186 |
| May | 605,903 |
| June | 567,725 |
| July | 543,667 |
| August | 617,791 |
| September | 589,018 |
| October | 591,750 |
| November | 549,602 |
| December | 526,961 |
| Total | 6,730,357 |
2022 Ridership
| January | 395,382 |
| February | 379,239 |
| March | 467,817 |
| April | 452,109 |
| May | 493,768 |
| June | 513,839 |
| July | 479,029 |
| August | 531,287 |
| September | 519,667 |
| October | 501,460 |
| November | 457,361 |
| December | 415,752 |
| Total | 5,606,710 |
2021 Ridership
| January | 387,504 |
| February | 347,776 |
| March | 439,623 |
| April | 419,081 |
| May | 405,344 |
| June | 413,232 |
| July | 432,195 |
| August | 453,105 |
| September | 443,558 |
| October | 447,871 |
| November | 426,799 |
| December | 418,443 |
| Total | 5,034,531 |
2020 Ridership
| January | 721,245 |
| February | 680,811 |
| March | 559,935 |
| April | 282,590 |
| May | 336,088 |
| June | 413,201 |
| July | 450,693 |
| August | 454,723 |
| September | 467,763 |
| October | 467,623 |
| November | 411,220 |
| December | 395,117 |
| Total | 5,641,009 |
2019 Ridership
| January | 673,825 |
| February | 677,602 |
| March | 715,165 |
| April | 750,005 |
| May | 773,315 |
| June | 714,565 |
| July | 749,394 |
| August | 804,097 |
| September | 974,161 |
| October | 926,158 |
| November | 788,240 |
| December | 698,328 |
| Total | 9,244,855 |
2018 Ridership
| January | 646,864 |
| February | 680,588 |
| March | 731,561 |
| April | 715,275 |
| May | 772,457 |
| June | 726,579 |
| July | 731,126 |
| August | 837,169 |
| September | 752,133 |
| October | 821,337 |
| November | 714,543 |
| December | 686,317 |
| Total | 8,815,949 |
2017 Ridership
| January | 722,556 |
| February | 723,107 |
| March | 748,944 |
| April | 712,254 |
| May | 743,143 |
| June | 732,211 |
| July | 683,472 |
| August | 805,712 |
| September | 748,970 |
| October | 763,319 |
| November | 719,176 |
| December | 651,903 |
| Total | 8,754,767 |
On-board surveys help IndyGo determine who is riding and how the system is being used. The survey’s results help with service planning and federal reporting to ensure service is distributed equitably to all passengers.
2022
Final Report
2016
Final Report
2009
Final Report
2001
Final Report
As a public agency that receives funding through the Federal Transit Administration (FTA), IndyGo is required by Title VI of the Civil Rights Act of 1964 to ensure that its programs and services do not exclude minority and low-income populations.
To ensure that we provide fair and equitable service to all populations, IndyGo must perform analysis by census tract and receive public input on any proposals that would significantly change service. If proposed changes to service do not disproportionately burden low-income/minority areas, changes may proceed. If the proposed changes are skewed to more negatively impact low-income/minority areas, the agency must find a way to justify or mitigate the impact.
The Federal Transit Administration (FTA), requires federal grantees to have a process for soliciting and considering public comment before raising a fare or carrying out a major service change. In compliance with this requirement, IndyGo has established a two-way communications program to ensure that all citizens, regardless of race, color, religion, income status, national origin, age, gender, disability, marital status, or political affiliation, have an equal opportunity to participate in IndyGo’s decision-making process.
Check out our Public Involvement Program.
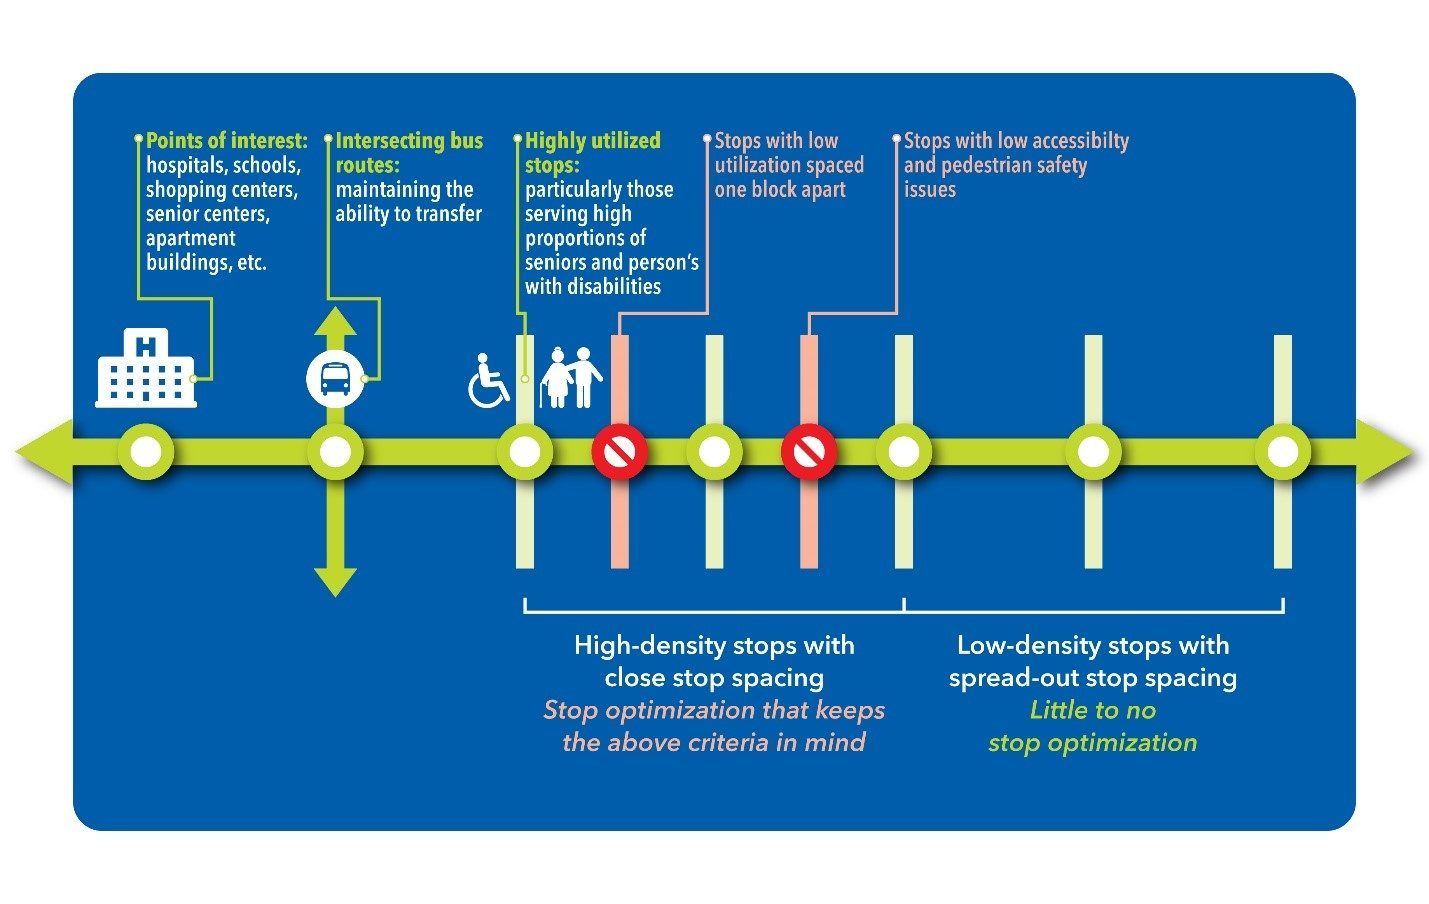
In Indianapolis, some of our bus stops are spaced too closely together. On a local bus route, stops should be within a convenient walking distance of each other – about a quarter mile. If stops are spaced much more tightly than that, buses spend an excessive amount of time stopped for boarding and at red lights. As part of the Marion County Transit Plan, IndyGo will balance our bus stops to allow people to get where they want to go faster. More detailed information about bus stop spacing can be found in the IndyGo Service Standards Document.
- Too many bus stops mean that buses aren’t moving as quickly as they should be.
- People who can currently reach multiple stops won’t see any difference. For riders at stops that have been moved, the maximum added walk time to a new stop should be ¼ mile – approximately five minutes.
- This (slightly) longer walk means a faster ride, which will enable people to spend more time doing the things they love.
How do we decide what stops to keep and what stops to remove?
- IndyGo will prioritize maintaining stops near points of interest, schools and hospitals.
- Stops that have lower ridership and pedestrian accessibility issues could be considered for removal.
Watch this video from the Transit Center to see how rebalancing bus stops speeds up the service dramatically.
To learn more about IndyGo’s current bus stop balancing initiative, visit indygo.net/stopchanges.
Bus Stop Balancing Video
The Paratransit Operational Analysis (POA) is intended to address identified issues that have resulted in declining quality of service provision and identify potential opportunities to improve service. The final report will provide recommendations to improve paratransit service.
Background & Public Involvement
Since 2009, various studies and sustained public involvement under the banner Indy Connect have helped sculpt a detailed plan for regional mass transit with the support of the Metropolitan Planning Organization (MPO) and Central Indiana Regional Transportation Authority (CIRTA).
An effective public involvement program provides for an open exchange of information and ideas between the public and transportation decision makers. The objective of IndyGo’s public involvement process is to support proactive public involvement at all stages of planning and project development.
Hundreds of public meetings to gather input from the public have taken place over the years to help refine what the transit priorities are for Central Indiana.
In October 2022, IndyGo held several community open house meetings to provide information on staff’s recommendations for how to move forward with the remaining local route improvements that are needed to fully implement the agency’s network redesign. The public was invited to attend and share their feedback on the proposed updates to the future service plan. Learn more about the project here.
In February of 2016, IndyGo introduced the Marion County Transit Plan to the public. Legal notices, paid radio and internet ads, on-board print and audio announcements, postings at major stops in the downtown area, direct communication to e-newsletter subscribers, social media, website updates, press releases and partner communications gave options to learn about the plan. In just over 5 weeks, IndyGo hosted or attended 17 meetings to promote the plan and gather feedback.
February through April 2016 Marion County Transit Plan Outreach Events:
| 2/5/2016 | MCTP Open House @ Central Library |
| 2/10/2016 | Indy Hub :: Dinner Series Irvington |
| 2/13/2016 | MCTP Open House @ Haughville Library |
| 2/15/2016 | MCTP Open House @ CAFE |
| 2/15/2016 | Town Hall Meeting @ Wayne Township Library |
| 2/16/2016 | Garfield Park Neighborhood Association Meeting |
| 2/22/2016 | Michigan Rd./ Riviera NA Meeting |
| 2/26/2016 | MCTP PUBLIC EDUCATION ADVISORY GROUP |
| 2/27/2016 | MCTP Open House @ Central Library |
| 2/27/2016 | Southside Envisiong Summit |
| 3/2/2016 | Downtown YMCA Top 10 Coalition MCTP Presentation |
| 3/8/2016 | Carriage House Apartments |
| 3/9/2016 | Indy Hub :: Dinner Series Nora |
| 3/9/2016 | IMPD Community Conversation |
| 3/10/2016 | Connexion Event hosted by Indy Chamber |
| 3/10/2016 | Warfleigh Annual Meeting |
| 3/14/2016 | MCTP Open House @ Nora |
| 3/16/2016 | tech + fashion + transit + urban |
| 3/17/2016 | Next Stop Opportunity |
| 3/21/2016 | MCTP Open House @ City of Lawrence |
| 3/23/2016 | MCTP Open House @ Speedway |
| 3/24/2016 | State of Downtown w/Downtown Indy |
| 3/30/2016 | MCTP Open House @ E. 38th St. |
| 3/31/2016 | MCTP Open House @ Indianapolis Urban League |
| 4/5/2016 | MCTP Open House @ Perry Township |
In 2014, IndyGo Forward helped set a direction for the agency’s future investments. Public discussions focused on the tradeoff between coverage-based services and ridership-generating services. With comments from IndyGo Forward and Indy Connect, a specific Marion County plan has been developed.
IndyGo collected comments at meetings, online, and through the customer service call center. Staff received and reviewed 97 comments.
Overall Comments – 97
- Positive – 36
- Better Frequencies – 5
- Longer Hours – 12
- Better Weekend Service – 11
- General Support- 15
- Neutral/Questions—34
- Clarification— 2
- Suggestion—32
- More Coverage – 17
- General Suggestion – 15
- Negative slant or concern expressed— 20
- Safety – 1
- Access/Usefulness – 5
- Farther Walk – 4
- Rail – 1
- Full-on Opposition – 3
- General Concerns – 3
- Cost – 3
Key Themes:
- Desire to have longer hours of service
- Cross-town Connections
- Citizens want greater frequency
- Access to routes
- Providing more coverage
- Better weekend service
The Marion County Transit Plan is generally well received. Positive feedback focuses on the benefits of increased service hours and general support for a more robust transit system in Indianapolis. The majority of the comments were questions and suggestions which centered on adding more weekend service and additional system coverage to reach areas currently not served. There are concerns about the consolidation of routes and how that will affect particular corridors in terms of ease of accessibility to routes. Some citizens are concerned about having to walk further to a stop. Additionally some have expressed the desire for more frequent service on the South and West sides of the city.
Staff reviewed comments and assessed what changes could be made to improve the plan and enhance equity especially on the west, south and southeast sides. A summary of the changes made to the plan follows:
- High frequency for West 38th Street.
- New north-south connection on west side to facilitate transfers outside of downtown.
- New service to Park Fletcher on southwest side.
- New service structure on near southside to better serve denser areas and improve service compared to current day.
- Improved frequency for inner southeast area including high frequency for South East Street and Beech Grove.
Benefits
Since 2009, the Indy Connect initiative has pulled together city leaders, neighborhoods, businesses, residents, local organizations, and national transit experts to look at transit service in Central Indiana and to map out what an improved transit system could look like in Indy. While transit isn’t a silver bullet, these groups recognize that access to useful, low-cost transit service has a positive impact on a number of issues Indy faces. Learn more about the benefits here.